Managing customer feedback across 300+ locations is a full-time job — unless you automate it.
Mountain Mike’s Pizza operates over 300 franchise locations across 11 states. Every day, customers submit feedback through the company’s website contact form — complaints about food quality, compliments for great service, delivery issues, refund requests, and everything in between. Before this project, those emails landed in a shared inbox and were handled manually. There was no centralized way to track trends, identify problem locations, or measure response times.
We built a system that changes that entirely.
The Problem
Franchise businesses face a unique challenge with customer feedback. Each location operates independently, but the corporate team needs visibility across all of them. When feedback arrives as unstructured emails, critical patterns get buried:
- Which locations generate the most complaints?
- Is food quality trending down in a specific region?
- Are certain franchise business coaches seeing more issues in their territory?
- How quickly is the team responding to negative feedback?
Without a centralized system, these questions go unanswered until a problem becomes too big to ignore.
The Solution: Automated Ingestion, AI Classification, and Real-Time Analytics
We designed a three-part system that turns raw customer emails into actionable intelligence — with zero manual data entry.
1. Automated Email Processing
Every night, our automation workflow connects to the company’s Microsoft Outlook inbox and pulls new customer submissions. Each email is parsed to extract structured data: customer name, contact information, store location, order details, and the message itself.
This happens automatically — no one needs to forward emails, copy-paste into spreadsheets, or manually categorize anything.
2. AI-Powered Classification
Each email passes through an AI analysis engine that classifies it across multiple dimensions:
- Category — one of 11 categories including Food Quality, Service, Wait-Time, Take-Out and Delivery, Pricing and Value, and Positive Feedback
- Severity — scored 1-5 with labels (Low, Medium, High, Critical)
- Sentiment — Negative, Neutral, or Positive
- Feedback vs. Non-Feedback — separates actual customer feedback from spam, job applications, and catering inquiries
- AI Summary — a concise summary of the issue
- Recommended Action — suggested next steps for the team
- Suggested Reply — a draft response ready for review
The AI handles the tedious work of reading, categorizing, and prioritizing — so the team can focus on responding and resolving.
3. Analytics Dashboard
All processed feedback flows into a real-time analytics dashboard built specifically for the franchise management team. The dashboard includes:
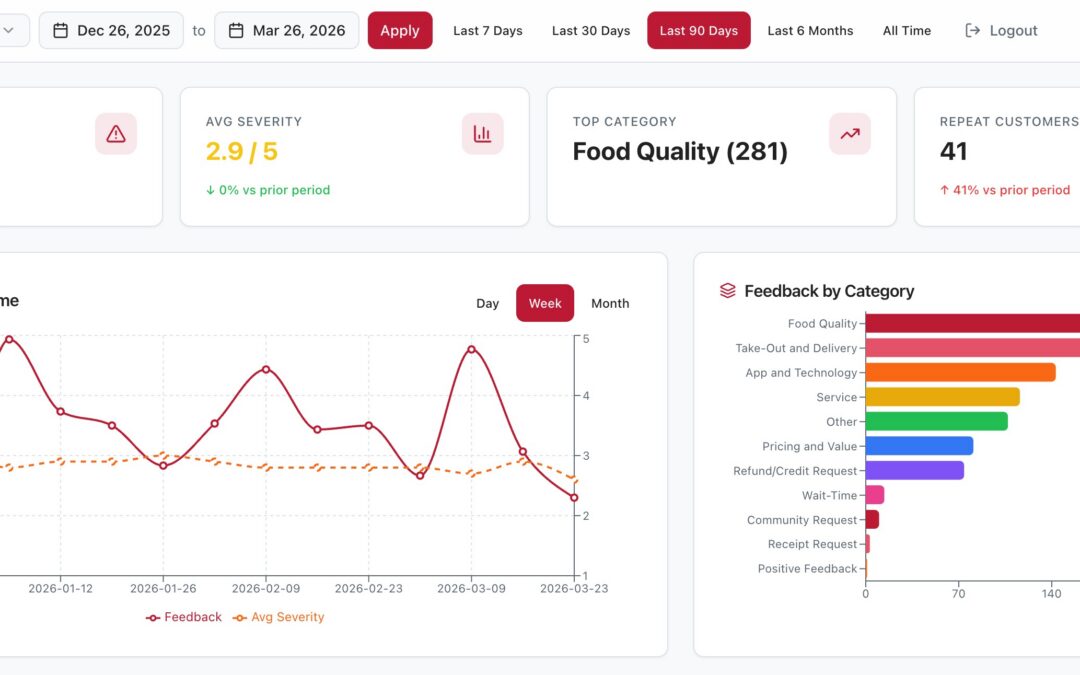
- Summary Cards with trend indicators — total feedback volume, average severity, top category, and repeat customer count, each compared against the prior period.
- Feedback Over Time — a time-series chart showing volume and average severity trends by day, week, or month.
- Category Breakdown — which types of feedback are most common, visualized as a horizontal bar chart.
- Category x Severity — a stacked bar chart showing not just which categories have the most feedback, but how severe the issues are within each category.
- Feedback by Location — the top 10 locations by feedback volume, helping identify stores that may need additional support.
- Order Method Breakdown — feedback distribution across dine-in, take-out, delivery, and online orders.
- Severity and Sentiment Distribution — donut charts showing the overall health of customer experience.
- Repeat Customers — identifies customers who have submitted multiple complaints, with drill-down to see their full history.
4. Location Management
With 300+ locations spanning multiple states, we built a dedicated location management system that maps every store to its:
- COOP — the marketing region (e.g., Bay Area, Sacramento/Stockton, Central Valley)
- FBC — the Franchise Business Coach responsible for that territory
This powers two critical capabilities:
Dashboard filtering by COOP and FBC — the corporate team can instantly filter all charts and data by marketing region or franchise coach. An FBC can see exactly how their territory is performing without sifting through data from other regions.
Automatic location matching — when a new email arrives, the system automatically identifies which of the 300+ locations it belongs to and links it to the correct COOP and FBC. No manual tagging required.
5. Operational Features
Beyond analytics, the dashboard includes tools for day-to-day management:
- Editable fields — team members can update the category, status, and notes on any feedback record
- Status tracking — feedback moves through statuses like Open, Done (FSC), Done (Local Team), and Follow-Up
- Archive and restore — completed items can be archived to keep the active view clean
- CCPA compliance — a dedicated page for searching and deleting customer data on request
- Magic link authentication — secure, password-free access restricted to authorized email domains
The Technology
The system is built on a modern, cost-effective stack:
- n8n (self-hosted) — workflow automation for email ingestion, parsing, and AI classification
- Anthropic Claude — AI engine for email analysis and classification
- Supabase — PostgreSQL database with real-time capabilities and row-level security
- Microsoft Outlook — email source via OAuth2 integration
- Custom dashboard — responsive web application with Supabase backend
The entire pipeline runs autonomously. The only ongoing cost is the AI classification API, which processes each email for fractions of a cent.
The Results
Since launching, the system has processed over 1,700 customer feedback records with:
- 95% automatic location matching — only 5% of historical records lacked location data
- Zero manual data entry — every email is automatically parsed, classified, and stored
- 11 feedback categories tracked with severity and sentiment scoring
- Real-time visibility across 300+ locations, 22 marketing regions, and 9 franchise business coaches
- Sub-second dashboard loading — optimized database queries with server-side aggregation
Why This Matters for Franchise Businesses
Customer feedback is one of the most valuable data sources a franchise business has — but only if it’s organized and accessible. A single email about cold pizza is easy to handle. Hundreds of emails per month across hundreds of locations, each needing classification, routing, and follow-up? That requires a system.
This project demonstrates how automation and AI can transform an overwhelming manual process into a strategic advantage. The franchise team now has the data to make informed decisions about training, operations, and customer experience — without adding headcount.
Interested in automating your business operations? Contact Sonnenberg Design to discuss how we can build custom automation solutions for your organization.